

Growth Creates Blind Spots
At some point, your brokerage got too big to know by feel. You used to spot who needed help by walking the floor, and past a certain size, that stops working. That’s what scale does.
Without clear data, a slipping agent can go unnoticed for weeks, coaching turns into guesswork, and every office you’re not standing in becomes a blind spot.
With the right view, you get clarity and your team leads get direction, without anyone feeling watched.
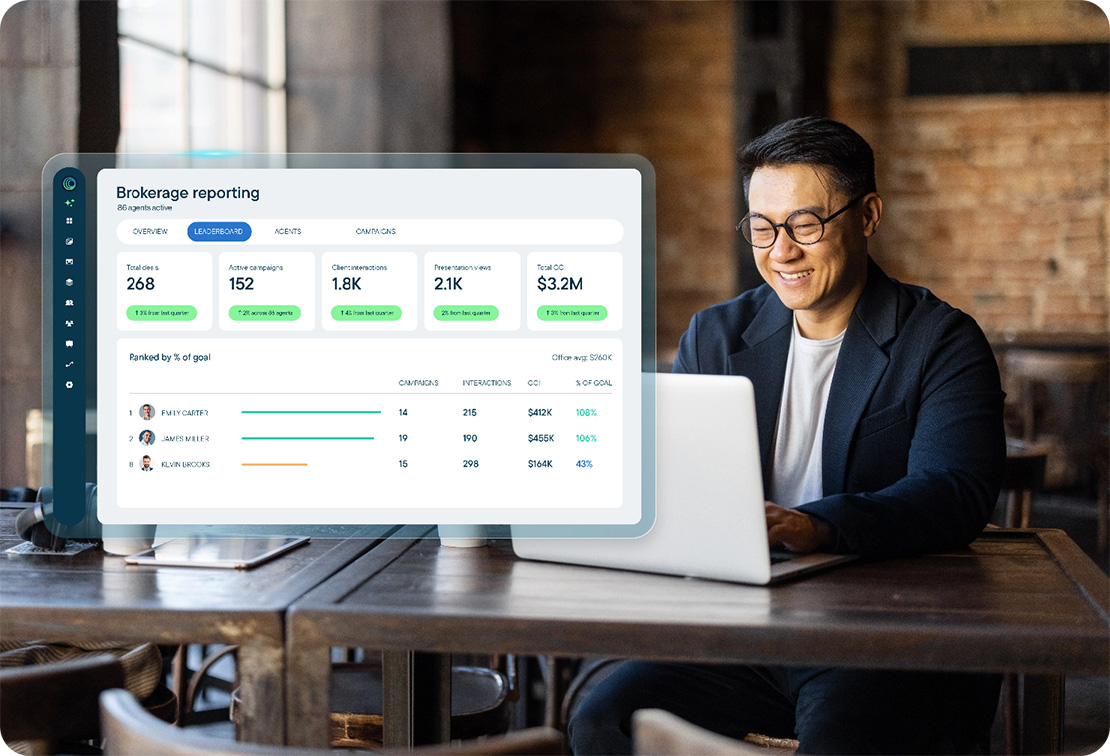
Here’s How  Shows You What’s Happening

Coming soon
See activity across every office in one place.
Reporting on agent activity, campaigns, and presentations rolls up from agent to team, office, and brokerage, whether you run one office or several.
Give team leads their own view.
Team leads see reporting for their own team, and you see every team across the brokerage, with no one building a report by hand.
Spot a drop in activity while there’s time to act.
When an agent’s activity starts to slip, you’ll see it early enough to step in with coaching.
See how brokerages grow revenue without adding headcount
Frequently Asked Questions
What is a real estate brokerage dashboard?
It’s a single view of what’s happening across a brokerage, from agent activity to engagement to performance trends, so no one has to piece it together from memory or spreadsheets. The value is in skipping the compiling: the numbers are ready when you need them. Brokerage reporting is coming soon to RISE, with activity rolling up from agent to team, office, and brokerage.
What agent performance metrics should a real estate brokerage track?
Track three things: how many contacts each agent is working, whether their outreach lands (opens and clicks on what they send), and how both trend over time. Closed deals show what already happened. Activity and engagement show whether an agent is on track or starting to stall.
How do brokers track real estate agent performance?
With data viewed together over time. A single production number can hide a lot: one big closing can prop up an otherwise quiet quarter. Looking at activity and engagement alongside production gives a coach something to act on while there’s still time left in the quarter.
What's the difference between agent performance management and agent performance analytics?
Agent performance management is the process: coaching conversations, goal-setting, and regular check-ins. Agent performance analytics is the data that process runs on, like activity and engagement numbers. Without analytics, coaching turns into guesswork. Without management, the data sits in a report nobody acts on. The two work best together.
How can brokers identify struggling agents early?
Watch for a drop in activity before it shows up in production: fewer follow-ups sent, fewer contacts touched, longer gaps between client conversations. Activity usually slips first, which makes it the earlier signal. Build the habit of checking activity trends on a regular cadence, alongside your quarter-end totals.
How can brokers improve visibility without micromanaging?
Focus on patterns. Reviewing activity trends weekly to spot a shift is visibility; asking an agent to account for every hour is micromanagement. Trends give you a coaching conversation grounded in facts, and nobody has to feel watched to get there.
What is real estate business intelligence?
It’s using a brokerage’s own data, like agent activity, engagement, and production history, to make decisions. Done well, it turns questions like “is this a good time to hire?” or “which agents need support?” into something you can check. Brokerage reporting is on the way in RISE and is a big part of where the platform is headed.
Can brokerage data be connected to other systems?
Yes. Today, agents can connect RISE with CRMs like Follow Up Boss and Cloze to sync contacts, so information doesn’t have to be re-entered by hand.